Analyzing Goalie Workload Patterns in NHL Totals Markets
Written by Anna Zimmermann · Sep 12, 2026
Analyzing Goalie Workload Patterns in NHL Totals Markets
Goalie Schedules Shape Scoring Outcomes
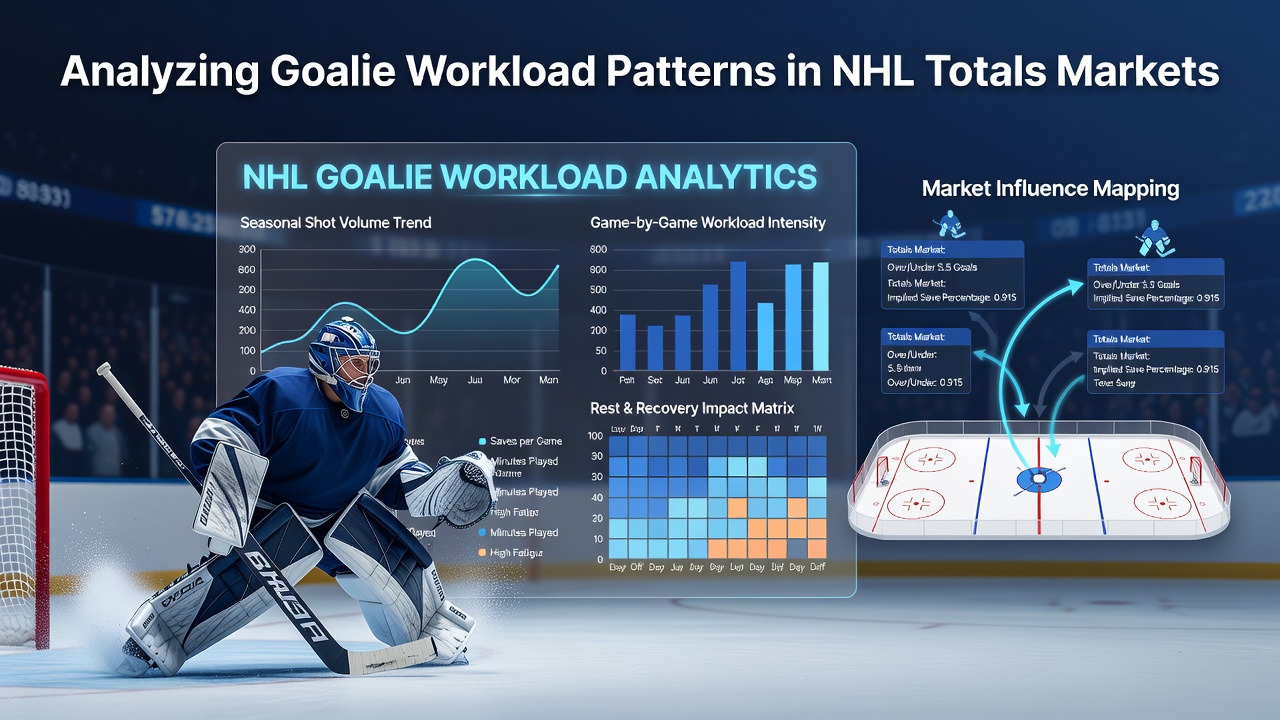
Goalie workload patterns influence totals markets because rested netminders tend to face fewer high-danger chances while those logging heavy minutes often allow more shots that find the back of the net, and analysts track consecutive starts, travel distance plus recovery time to quantify these effects across the regular season. Data from the 2025-2026 campaign showed teams starting the same goalie on back-to-back nights posted average totals 0.7 goals higher than games featuring at least one full day of rest, according to league tracking systems.
Key Metrics Used in Workload Analysis
Researchers examine several variables when evaluating workload impact, including games played in the prior seven and fourteen days, average shot volume faced per start, and cumulative time on ice adjusted for overtime contests, while advanced models also incorporate travel across time zones and the physical demands of facing elite shooters repeatedly. These measurements help bettors and oddsmakers project whether a particular matchup will trend toward higher or lower goal counts.
Rest Patterns and Their Statistical Correlations
Studies compiled by Canadian sports analytics groups reveal that goalies returning from three or more days off post an average save percentage 1.8 points above their season norms, which directly correlates with lower totals, and the same reports note that netminders appearing in four of five games see their goals-against average rise by 0.32. Observers note these shifts become more pronounced after the All-Star break when schedules tighten and recovery windows shrink.
September 2026 brings renewed attention to these metrics as teams finalize rotation plans ahead of the new campaign, with preseason data already highlighting several clubs planning to limit veteran goalies to no more than two starts per week during October to preserve freshness for later months.
Application to Over/Under Markets
Totals bettors incorporate workload data by cross-referencing projected starting goalies against recent usage logs, and this approach has gained traction because public betting often overlooks subtle rest advantages that move lines by half a goal or more. When a tandem shares starts evenly, totals markets tend to settle closer to the posted number, whereas heavy usage on one netminder frequently pushes scoring upward, especially against offenses that generate sustained pressure through the neutral zone.
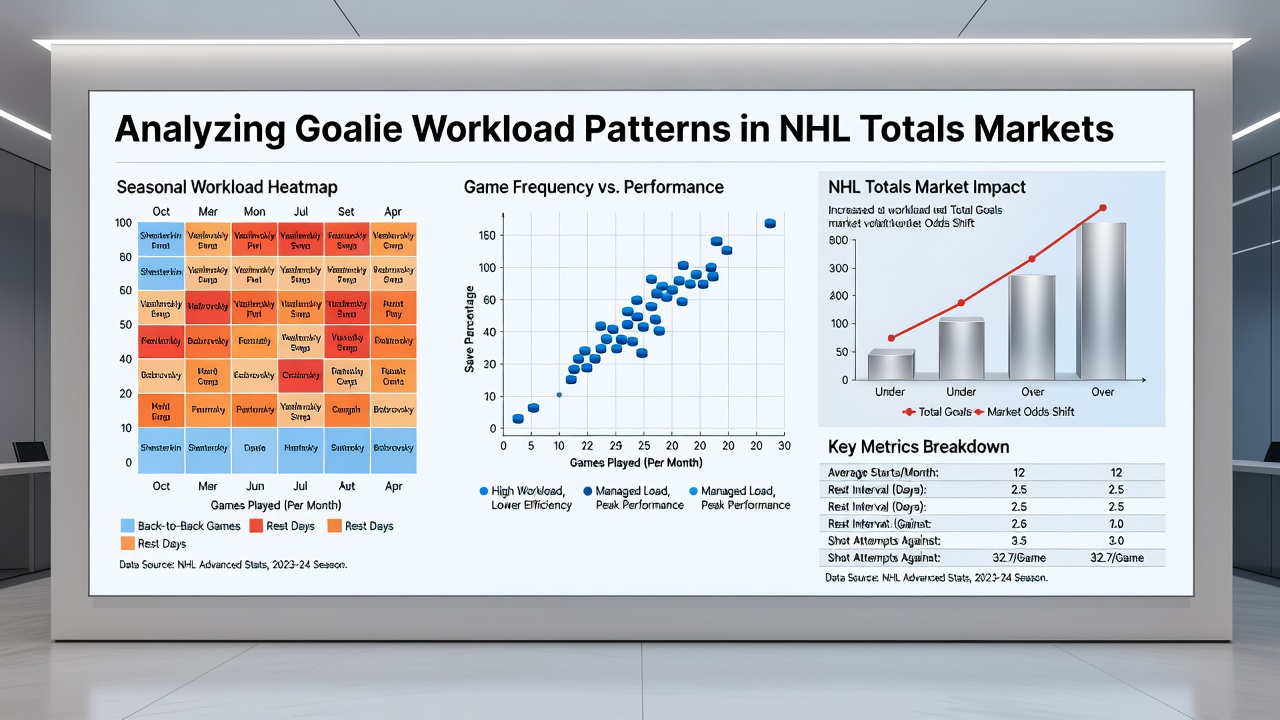
One study released by a U.S. university sports research center found that workload-adjusted projections improved totals accuracy by 11 percent over baseline models that ignored rest factors, and the improvement held steady across both home and road environments. Those findings prompted several professional handicapping services to integrate similar variables into their nightly breakdowns.
Regional Differences in Usage Trends
Teams based in colder climates or with shorter travel itineraries often maintain tighter goalie rotations, while clubs covering larger geographic footprints show greater variance in starter distribution. European-born goalies, according to league participation data, average slightly fewer consecutive starts than North American counterparts, a pattern some attribute to differing junior development systems that emphasize recovery protocols earlier in careers.
Betting markets adjust totals lines accordingly once starting goalies are confirmed, yet sharp action frequently appears before official announcements because workload models can forecast likely starters with high probability once coaching tendencies become clear over multiple seasons.
Case Examples from Recent Seasons
Take one Eastern Conference club that leaned heavily on its primary goalie through December 2025 only to see totals rise sharply in January once fatigue indicators appeared in tracking data. Another Western Conference squad rotated its tandem more evenly and posted totals that landed under the number in 62 percent of home contests during the same stretch. These examples illustrate how workload distribution creates measurable edges when combined with shot-quality metrics and opponent offensive ratings.
Industry organizations such as the Hockey Canada analytics division continue to publish aggregated workload reports that support these observations, while additional research from Australian sports performance institutes has begun examining similar patterns in other professional leagues for comparative purposes.
Conclusion
Goalie workload analysis supplies objective inputs that refine totals projections throughout the NHL schedule, and continued collection of rest, travel, and usage statistics promises further refinement of these models in future seasons. Observers expect September 2026 updates to incorporate expanded biometric tracking as more clubs adopt wearable technology for daily monitoring.